Visualization
Learn how to use the low-level validation views in the Employee Shift Scheduling model to validate individual shifts and employee schedules. These views work at the most granular level of the schedule. Use them when you investigate specific assignments or explain individual results to planners and stakeholders.
By employee
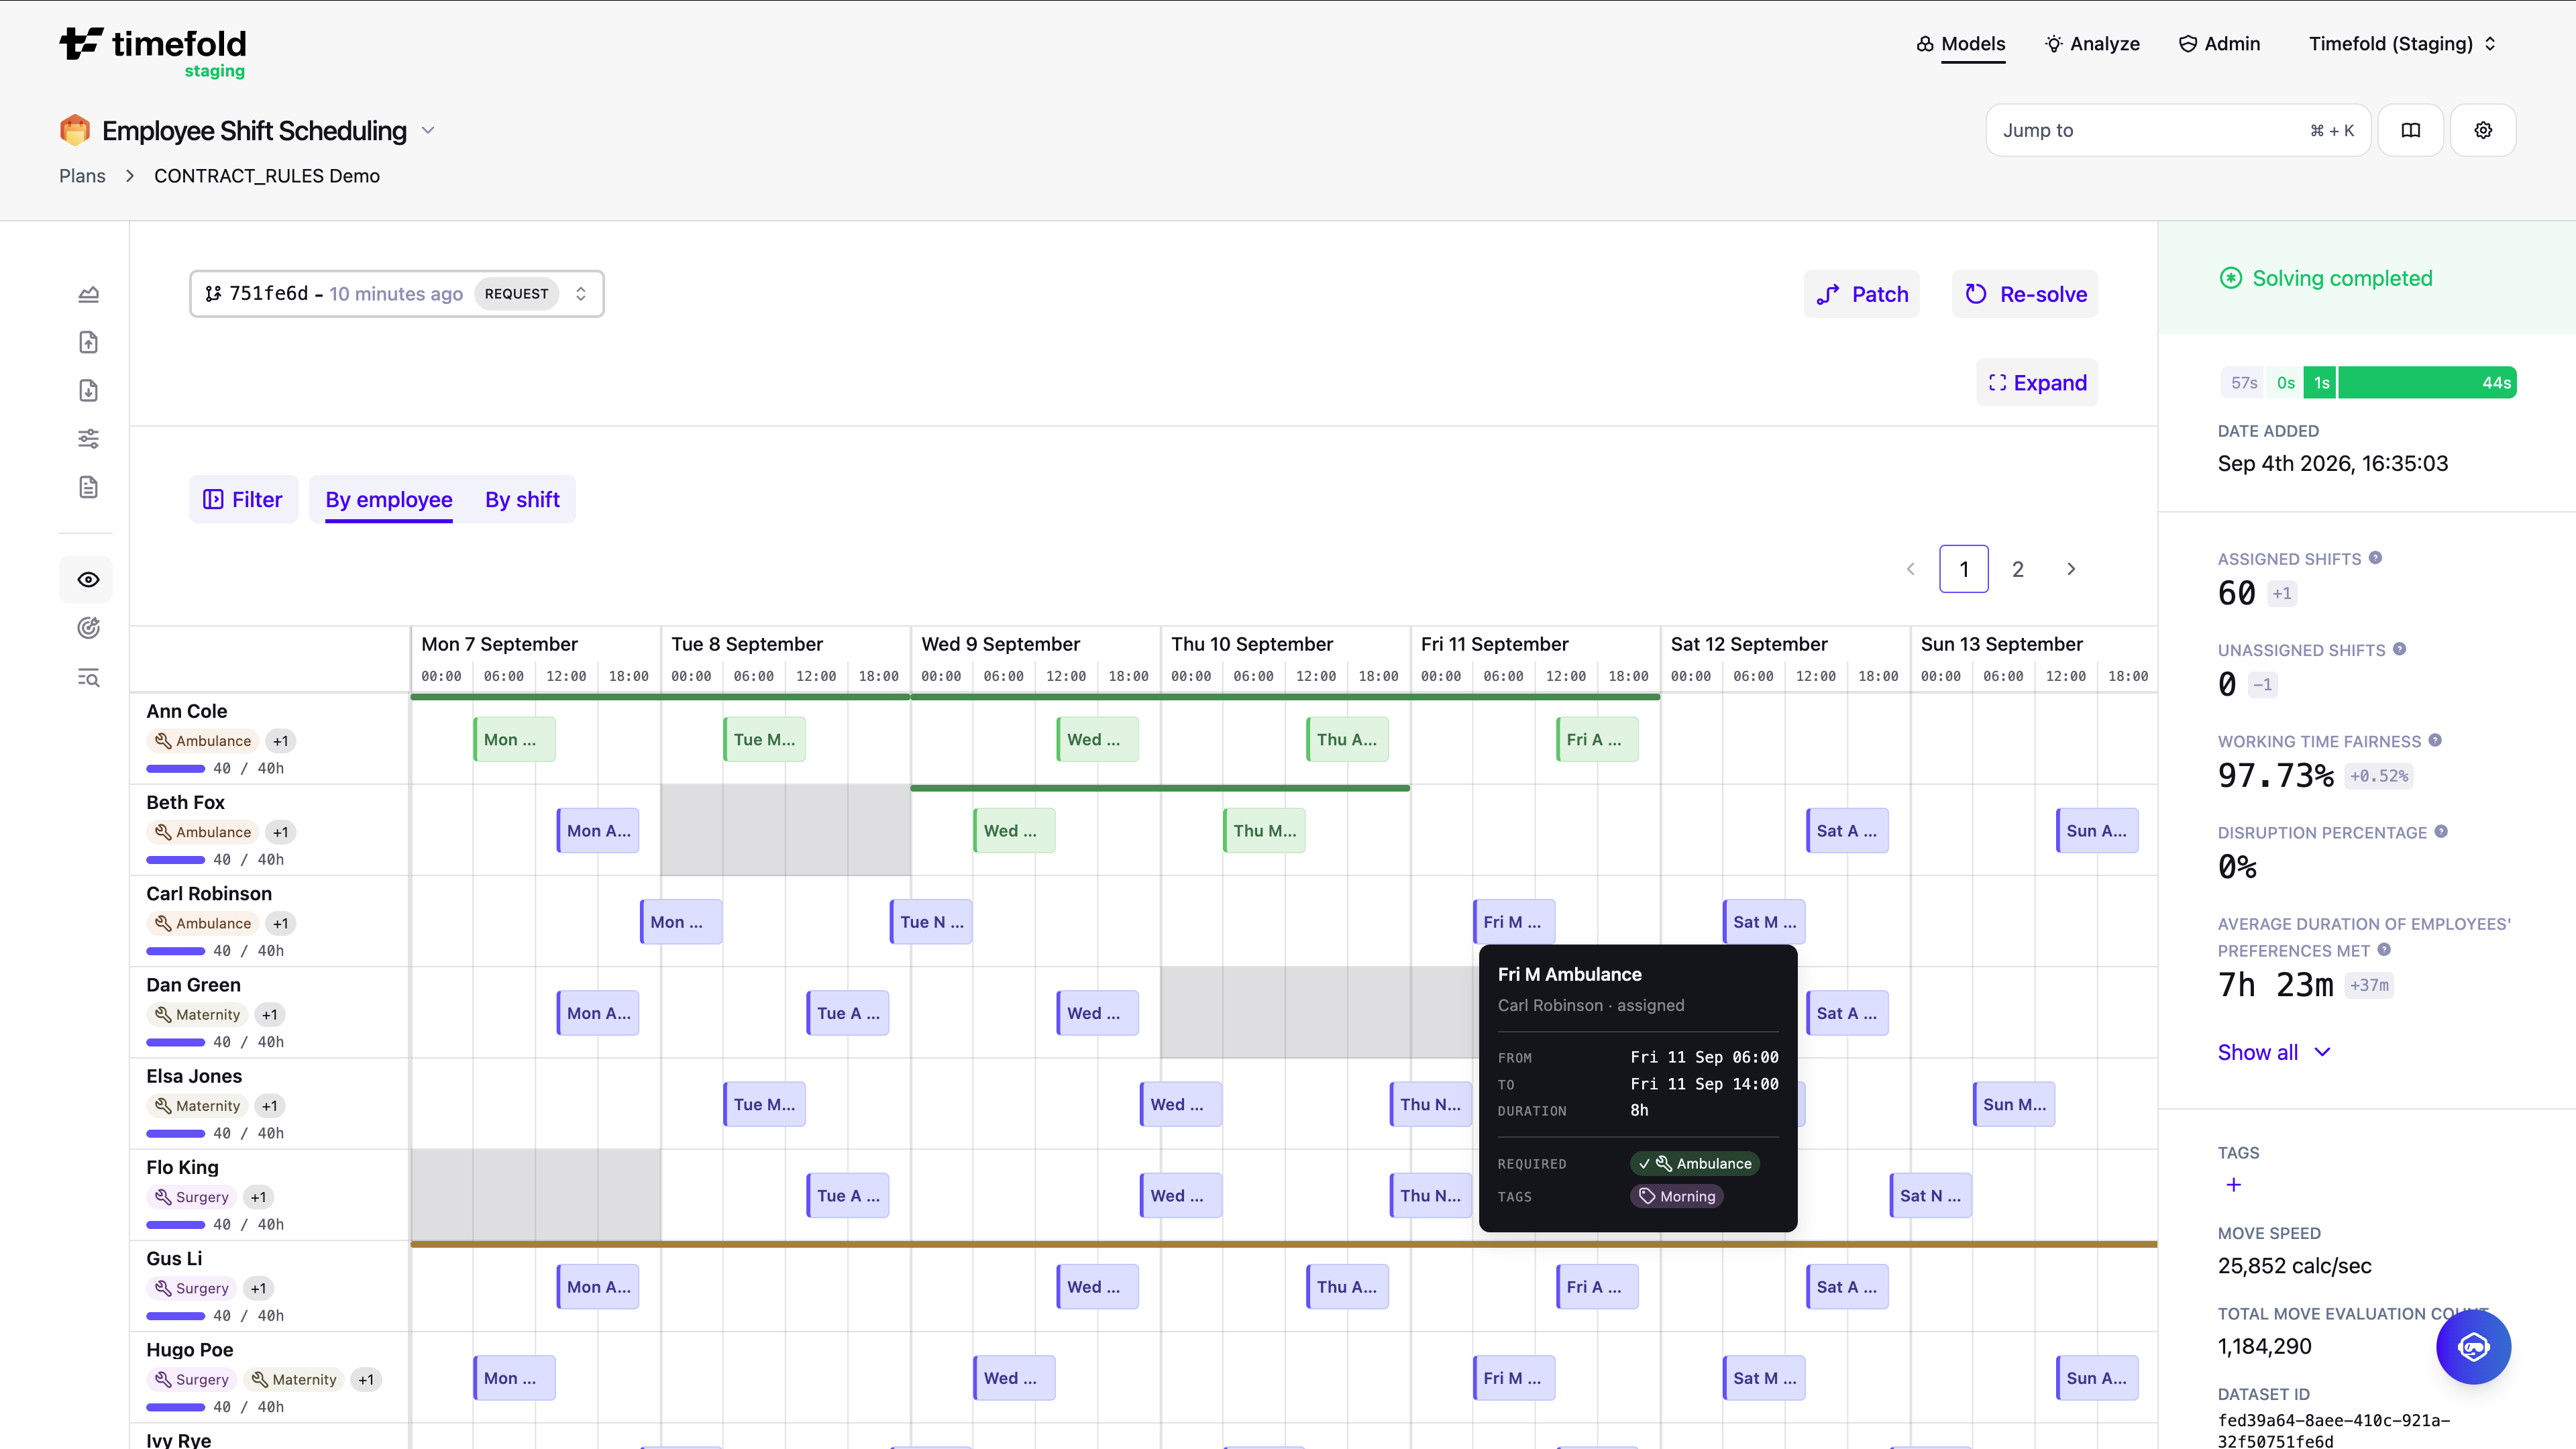
Primary focus: Detailed employee-level validation.
The By employee view organizes the schedule by employee. Each row shows:
-
Assigned shifts
-
Unavailability periods
-
Preferences and unpreferences
-
Skill tags and contract types
Pagination controls allow you to navigate through the employees. Pagination is ordered by employee ID.
Filtering
Every visualization view supports filtering. Click Filter in the view’s toolbar to drill down into a subset of the data. Combine multiple filters to narrow the view to exactly the data you want to inspect.
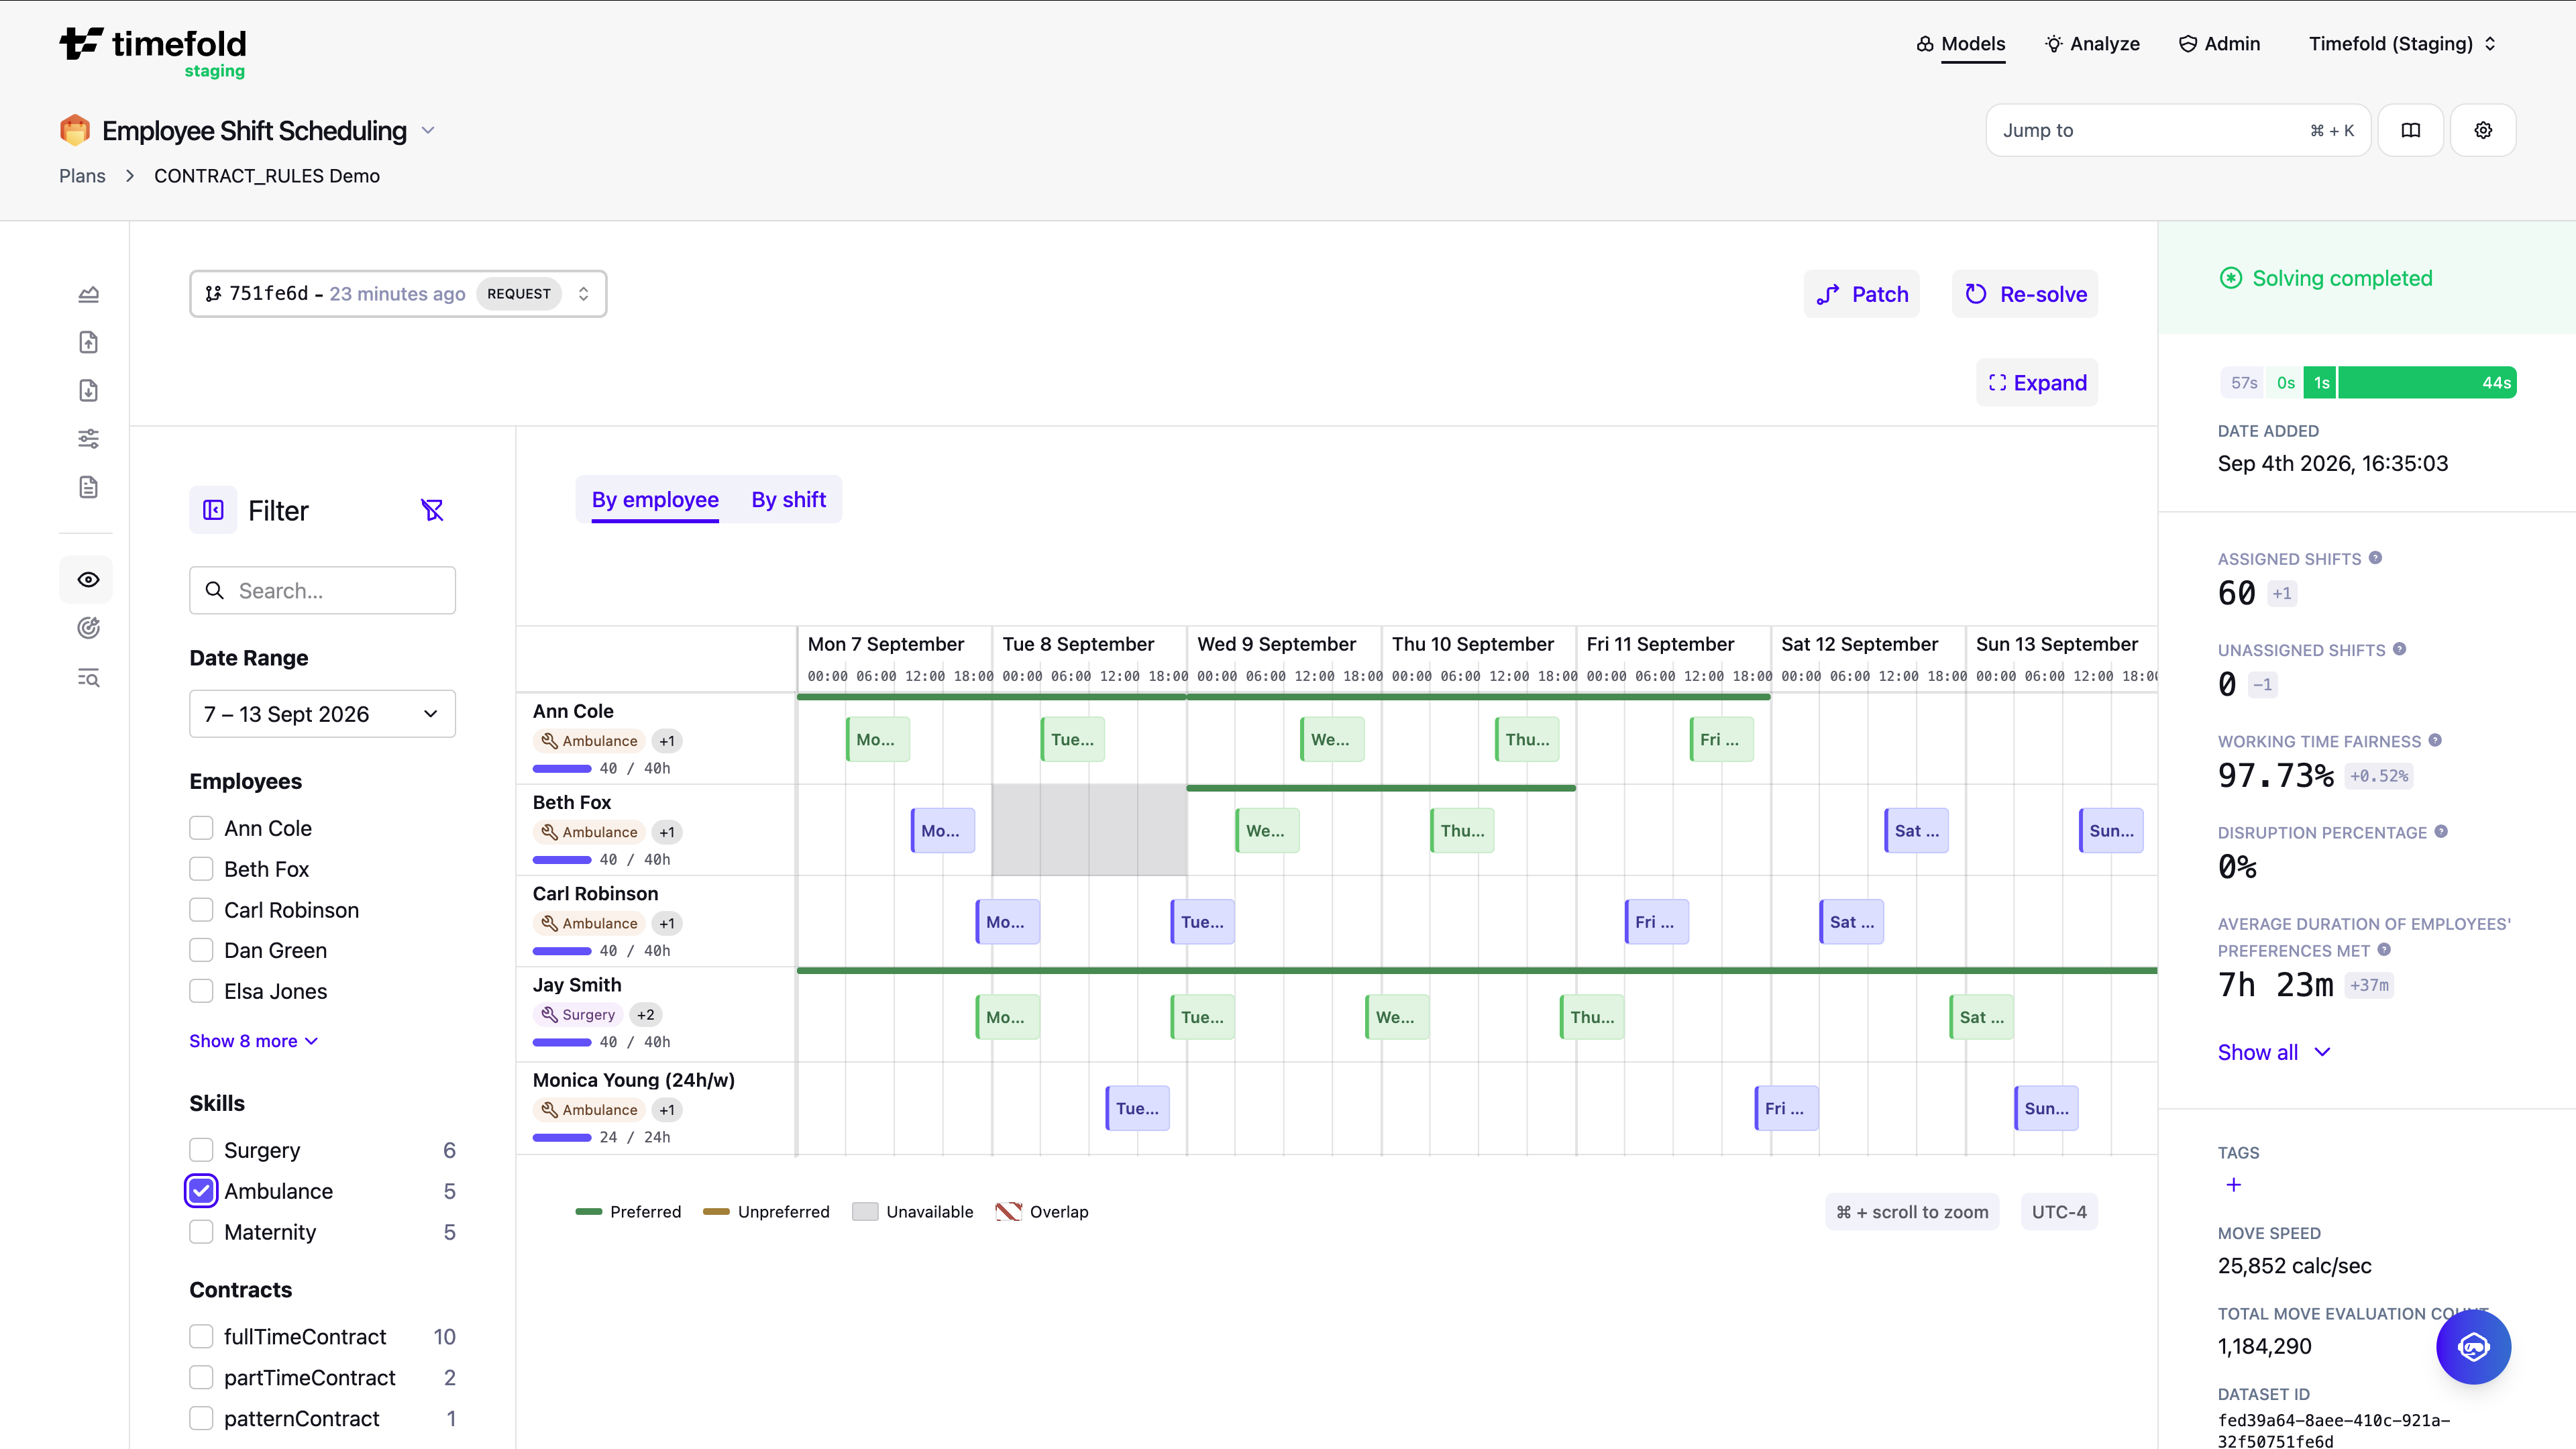
In the By employee view, you can filter by date range, employee, skill, contract type, and more.
By shift
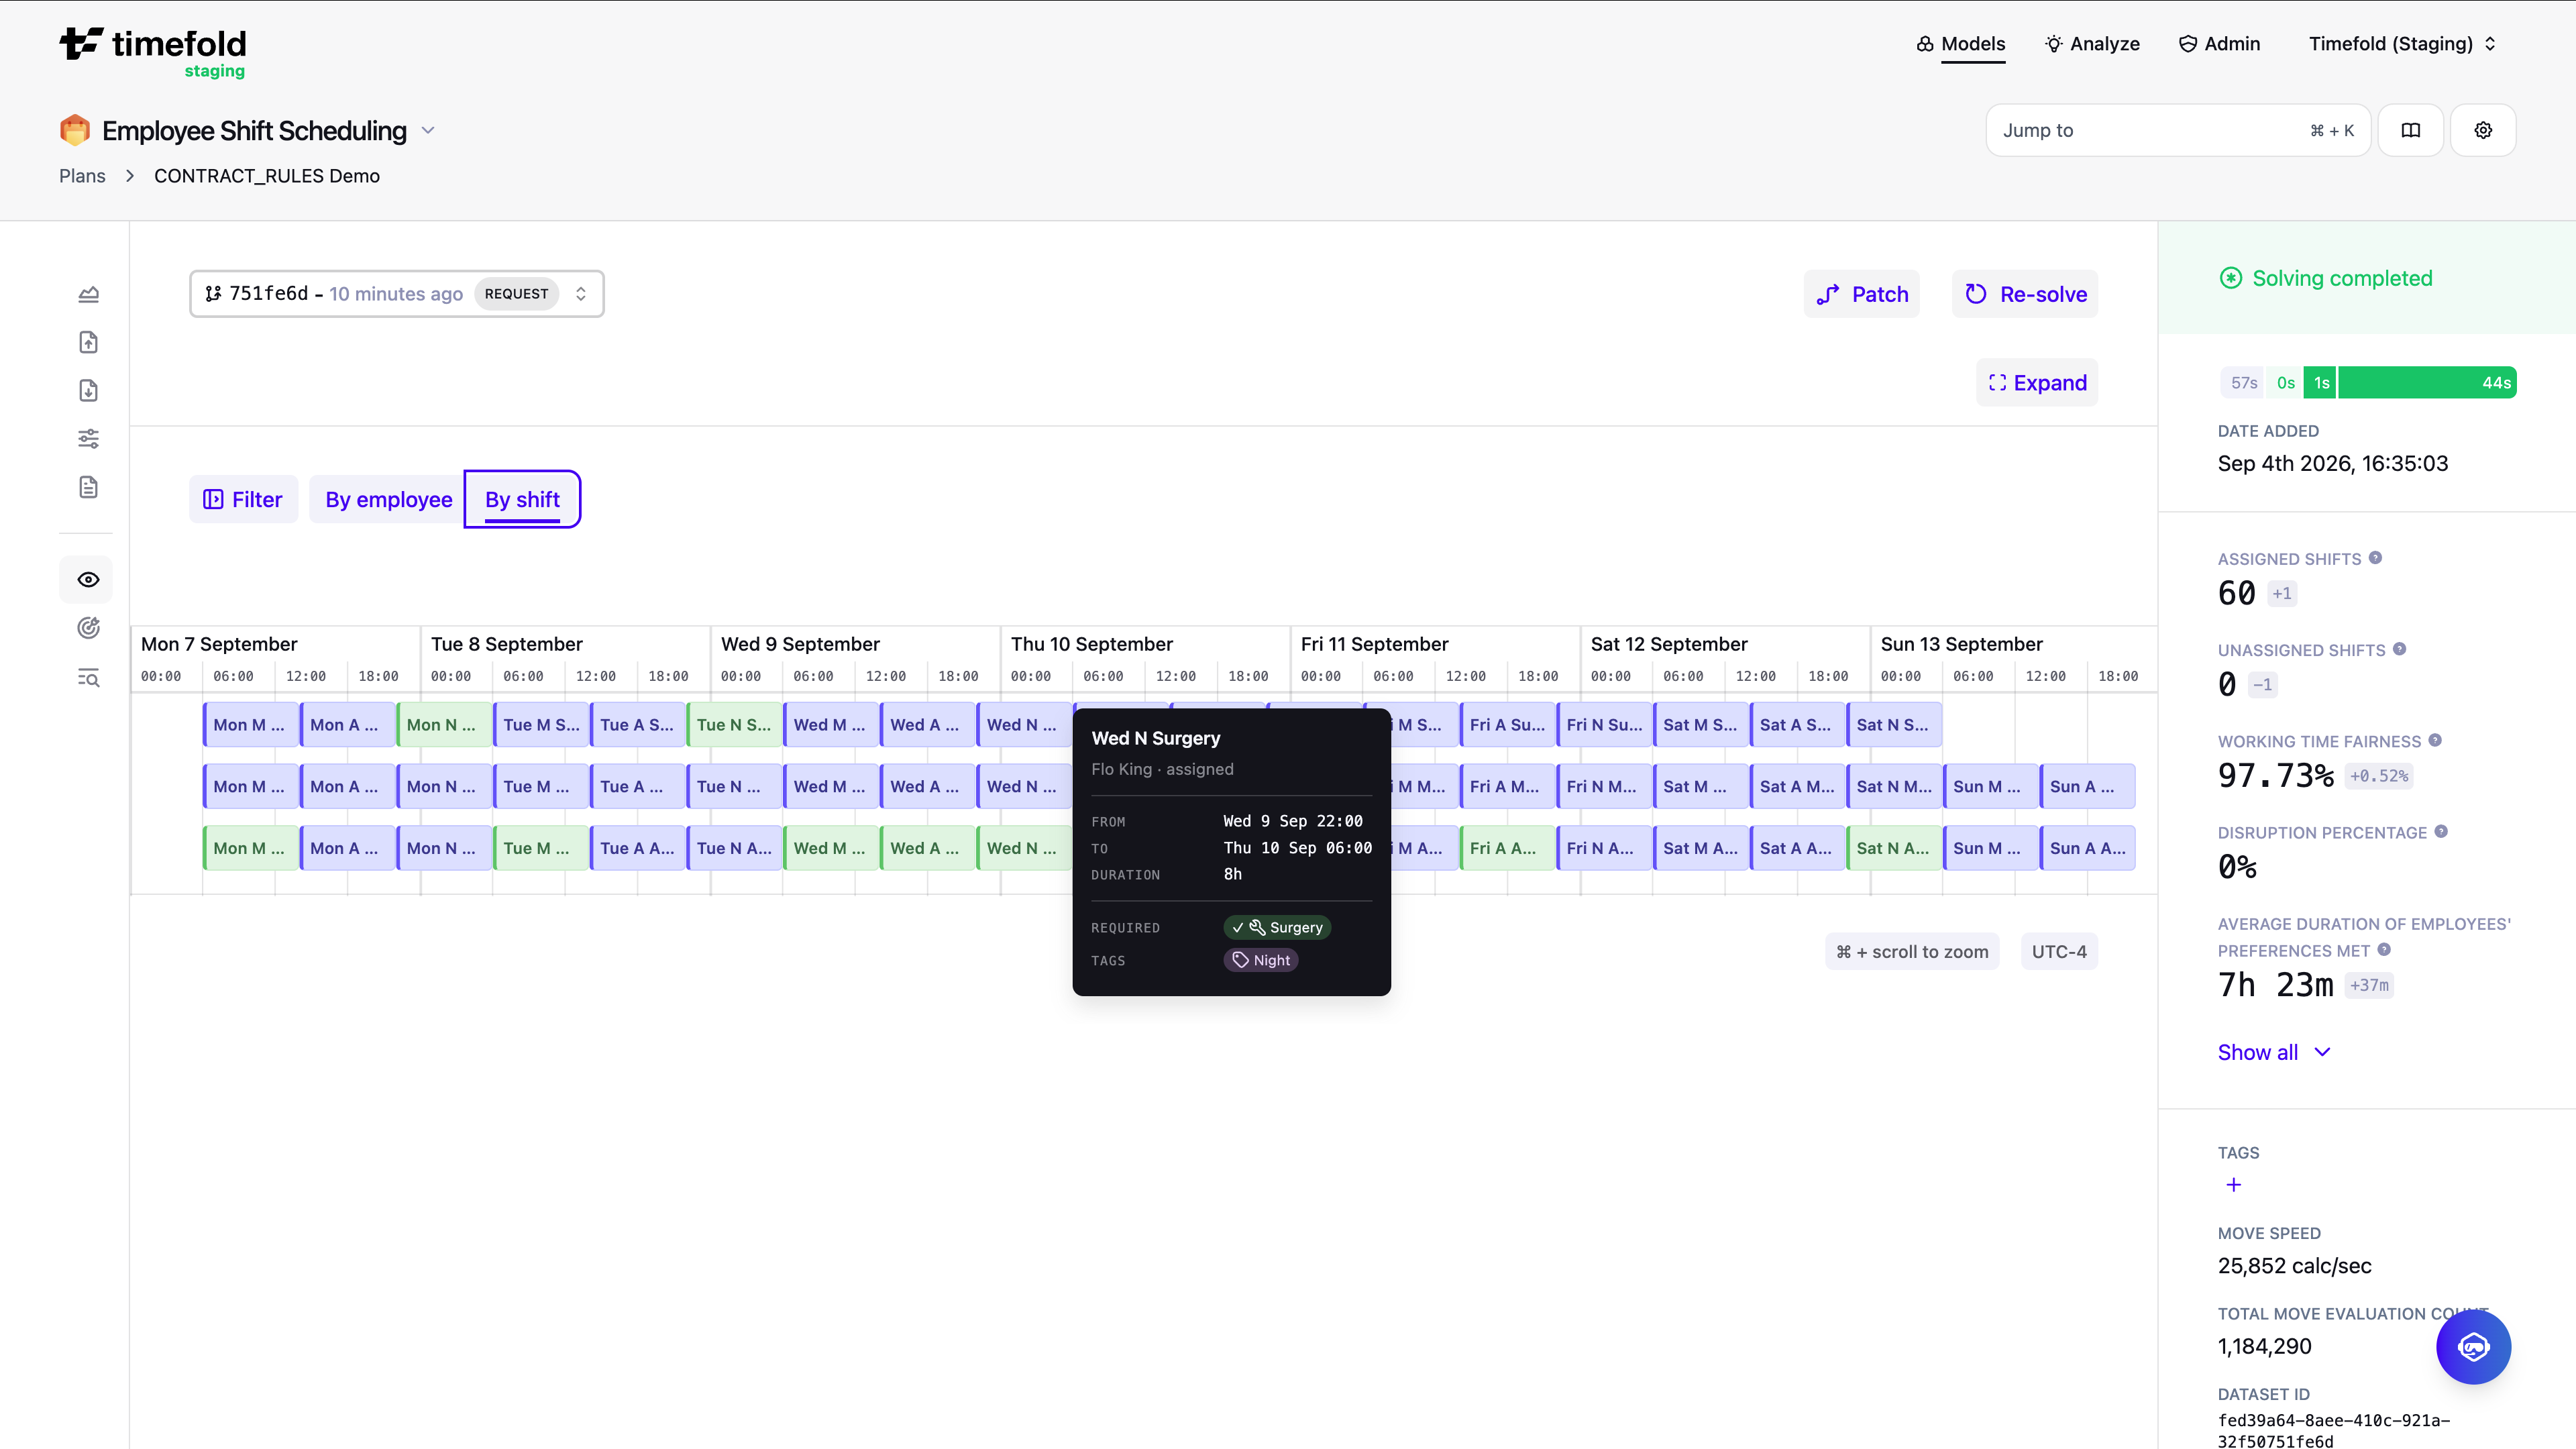
Primary focus: Detailed shift coverage validation.
The By shift view shows the schedule as a time-based grid of shifts across days.
Each block represents a shift and displays:
-
Assigned employees (or "Unassigned" if not covered).
-
Shift details like required skills, priority, start and end time (hover over the shift for details).
Pagination controls allow you to navigate through the shifts. Pagination is ordered by shift ID.
Filtering
Every visualization view supports filtering. Click Filter in the view’s toolbar to drill down into a subset of the data. Combine multiple filters to narrow the view to exactly the data you want to inspect.
In the By shift view, you can filter by date range, shift ID, tags, skills, and more.
Other views
The By shift and By employee views validate individual assignments, but they don’t reveal structural patterns across the whole dataset.
To detect coverage, overtime, and fairness issues at a strategic level, use the Efficiency X-Ray.
To identify shifts that are impossible or difficult to fill before optimization runs, use Assignability analysis.
See Recommended analysis workflow for a structured approach that combines all views.
Recommended analysis workflow
A structured approach:
-
Use Assignability analysis to detect structurally impossible or difficult-to-fill shifts in the input data before optimization.
-
Dive deeper into By Shift Efficiency X-Ray to see high-level coverage bottlenecks in the optimized result.
-
Inspect problematic time slots in By shift.
-
Review affected employees in By employee.
-
Validate utilization and fairness in By Employee Efficiency X-Ray.
-
Use these insights to inform strategic decisions, fix input data issues and test different scenarios with Experiments.
Next
The visualizations help you understand the what of a schedule, which is a first step to understanding the why and the so what.
-
For guidance on how to validate and explain optimized plans, see the Validating an optimized plan with Explainable AI guide. This guide explains why trust and explainability matter when presenting a plan to planners and stakeholders. How to check correctness, understand trade-offs, and communicate why certain assignments were made. It shows how visualizations, real-world metrics, and explainability features work together to build confidence in a schedule rather than treating it as a black box.
-
For a broader view on diagnosing and resolving operational bottlenecks, the Uncovering inefficiencies in operational planning guide provides useful context. It discusses common sources of planning inefficiencies (such as under- or over-utilization, skill mix issues, and demand imbalances) and how planning optimization can help you pinpoint structural problems in your workforce plan.
-
Once you’ve identified a scenario worth testing, use Experiments to systematically compare it against your baseline before applying it to production.